Server Energy Efficiency tool released

Today SPEC released a major update to its server energy efficiency rating tool, SERT. See press release.

Created initially for the requirements of the US EPA Energy Star program, it also takes into account the needs of regulatory agencies worldwide. SPEC also has considered the requirements of the
European Union’s DG ENTR Lot 9 Ecodesign Directive for enterprise servers, the Chinese National Institute of Standardization (CNIS), and Japan’s Ministry of Economy, Trade & Industry’s (METI) Top Runner energy efficiency program. The SERT user guide is available in Chinese as well as English: 服务器功效评估工具(SERT) -用户指南

Figure 2: Memory channel impact on CryptoAES.
From “The SERT Metric and the Impact of Server Configuration“
Copyright © 1988‐2017 SPEC

Among the news in SERT 2 is the addition of a single-value composite metric to quantify server efficiency across different workloads. An excellent description of SERT (referring specifically to the 1.1.0 version) was given at the Beijing 2016 SPEC Summit. See slides.

As SERT adoption spreads, computer vendors will be able to run a single test to produce data to establish compliance with energy regulations. Even when different nations set different threshold criteria and other requirements, the benefit to vendors remains of having to run a single test to sell worldwide instead of 195 different tests for every nation. For consumers the benefit is in having energy regulations tied to a measure that accurately reflects the energy usage of the computing equipment.

A Tool Not a Benchmark

SPEC is clear that SERT is a tool, not a benchmark. That seems like a distinction without a difference because it’s also clear that any benchmark can be used more generally as a tool to investigate performance characteristics, and that SERT scores could be used as benchmark results. The differences are in intent and in license restrictions.

Regulatory programs like US EPA Energy Star like to say if your product meets this value it is compliant with our low energy standards and it may be sold in certain realms, and if it fails to meet that value it is not compliant and other restrictions apply. They want a measure of the power and performance of the server “out of the box.” In traditional benchmarks by contrast we want to show how well the server can perform, typically including expert performance tuning. There are usually restrictions on what tuning may be performed in order that the benchmark result remains representative of the performance ordinary users will see in the real world. But the emphasis is on comparability between systems, hardware platforms and/or software systems.

Fair Use

SERT is run with a limited set of reasonable tuning options reviewed and agreed ahead of time by the SPEC committee. So for the tester it’s simple. Just install SERT and run the test. The scores are meant to determine compliance with energy regulations, not to compare one server or processor or software stack against another. For that purpose you do much better to use an energy efficiency benchmark such as SPECpower_ssj2008 or one of many other benchmarks from SPEC and other organizations which have adopted the SPEC Power Methodology.

The Fair Use Rules are the reason you don’t see lists of SERT results. The software license prohibits making such competitive comparisons. The combination of the legal restriction plus the ready availability of superior measures for marketing comparisons and for academic research has worked very well to keep SERT in its proper place in the regulatory domain.

Performance Trajectories – speed and throughput

Among the challenges SPEC faces in addressing change in the computing industry is the very trend which SPEC has done more than anyone to bring about. That is the rapid growth in computing power – close to 10,000 times the single thread performance today as the venerable VAX-11/780.

Dr. Stephen Edwards teaches performance history at Columbia. See on this (log scale) relative performance chart the rate of increase taking off (+52% per year) in the early 80’s as the RISC vs. CISC wars ignited, sometimes called the benchMarketing wars as exaggerated and loosely substantiated claims were common, which in turn led to the creation of SPEC to standardize the metrics and test protocols. Edwards shows the rate of improvement slowing from 2002 down to +20% per year.

Click on this chart through to his course handouts to see detail on the chart of processor names (remember Alpha?) and discussion of where the performance improvements came from. He discusses thermal and power issues driving the shift to multi-core, and the memory bottleneck.

Now read Jeff Preshing’s analysis showing +52% increase per year slowing from 2004 to +21% per year. Preshing marks the inflection point with publication of Herb Sutter’s paper “The Free Lunch Is Over: A Fundamental Turn Toward Concurrency in Software.” Today’s processors are multi-core and those cores are mostly multi-threaded. Preshing also observes that the rate of increase for non-Intel processors has been only +13% per year.

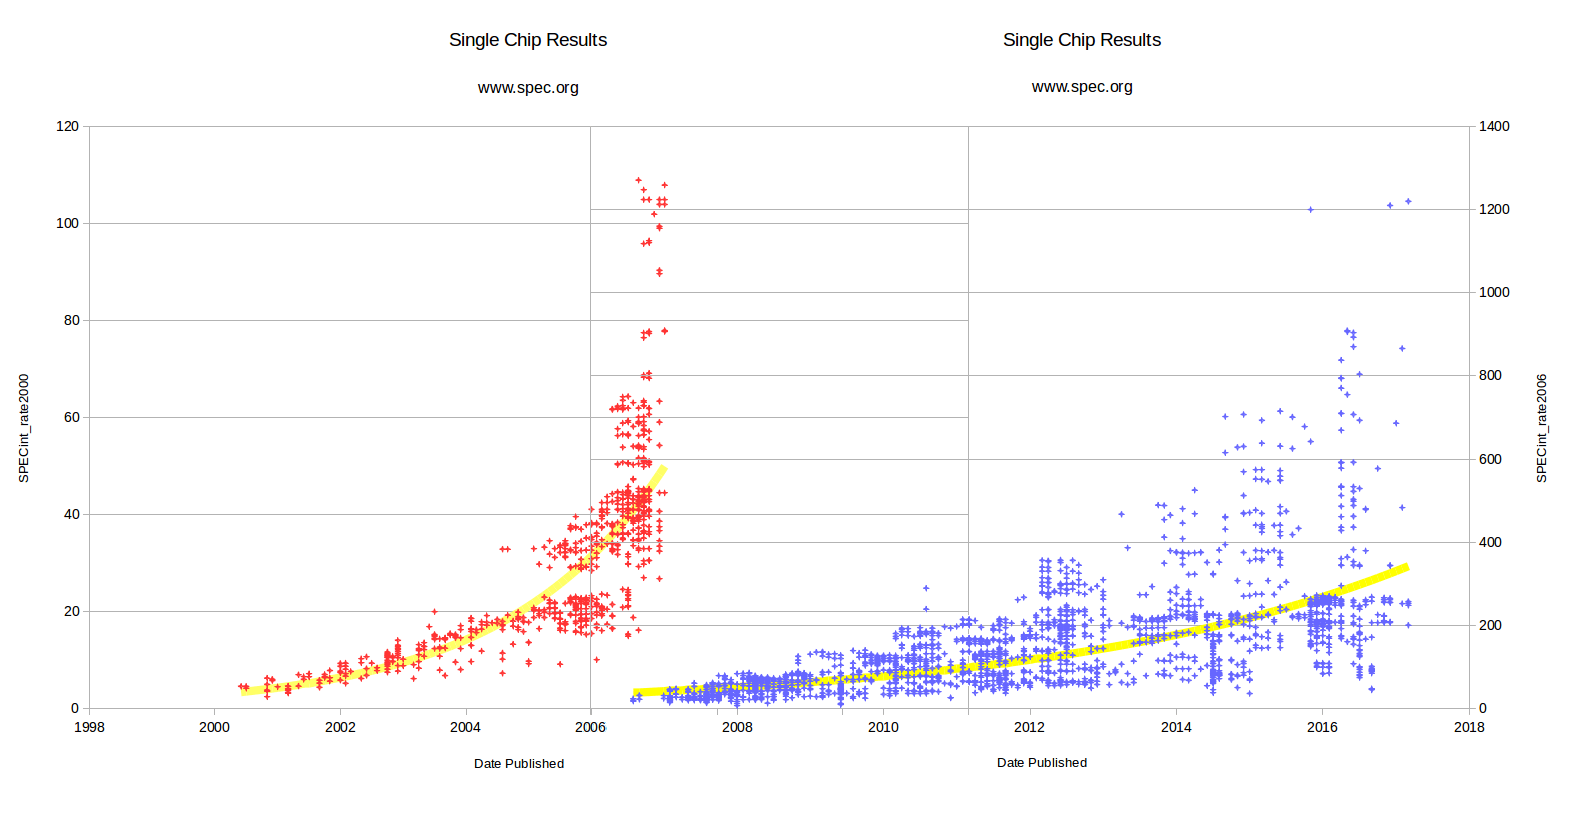
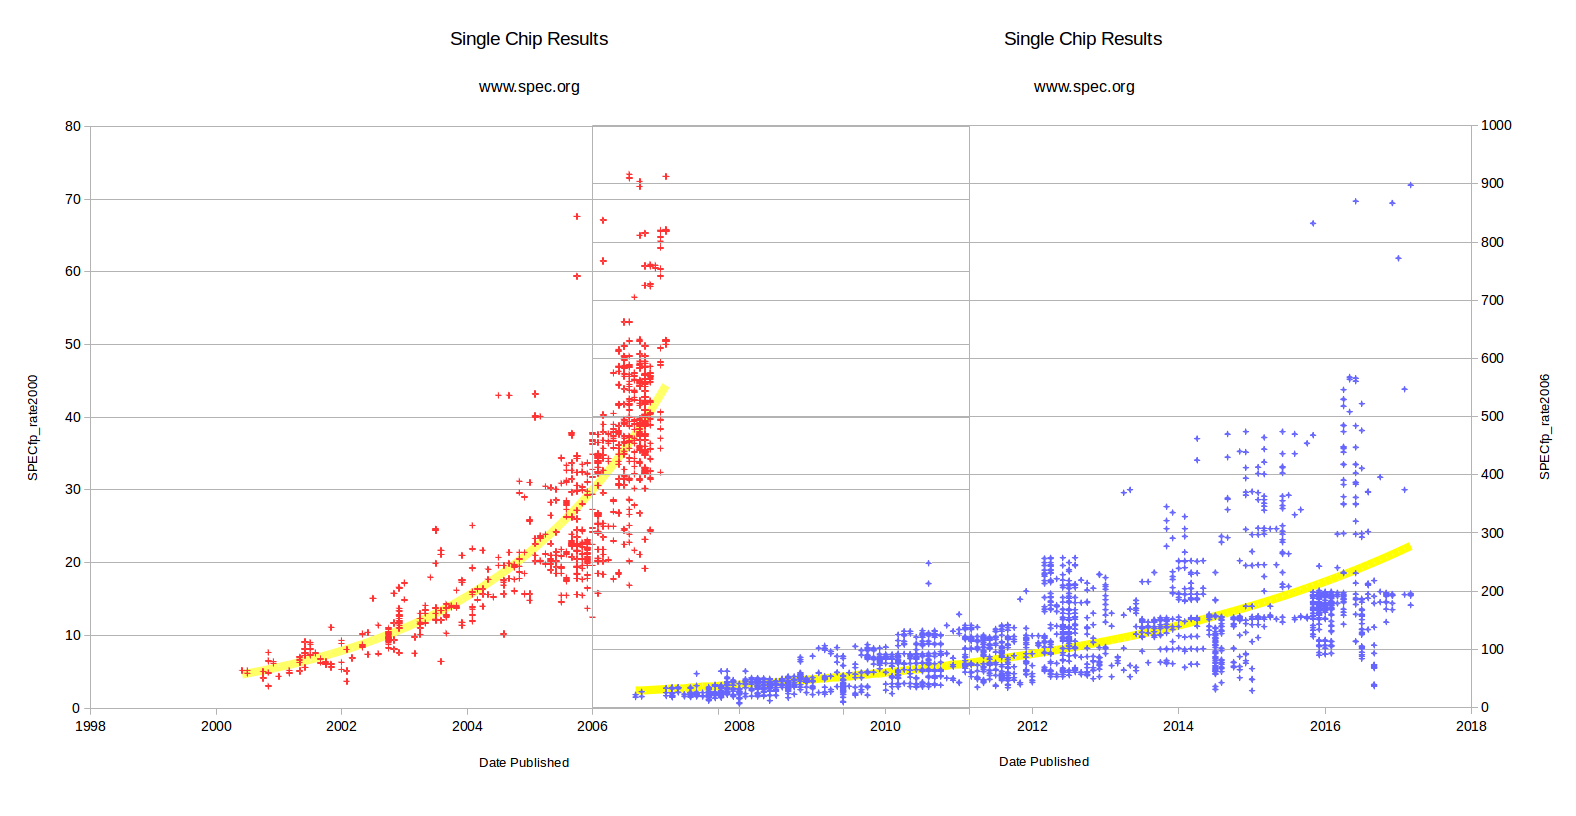
Now let’s look not just at single thread speed but at the total computational power available to applications running on the processor. I considered all compliant CPU 2000 and CPU 2006 results published on spec.org of the “rate” or computational throughput metric, for systems with a single processor. I used the “peak” or highly tuned metric and for a small number of results with no peak metric I used their “base” metric. This gave me about 800 each integer and floating point results for CPU 2000, and 3,000 each for CPU 2006.

Here are the integer results plotted on a linear scale with a trend line plotted as a logarithmic least squares regression. In 2006 you see the transition with a brief overlap when SPEC published results from both the old and the new benchmarks. I did not attempt to normalize the two benchmarks to a common scale as some have done because there is no simple “conversion factor” from CPU 2000 to CPU 2006. If there were, of course SPEC would have had no reason to develop the latter benchmark. You can see generally how such a normalization would work by moving the CPU 2006 graph up so that its trend line starts where the CPU 2000 trend line ends.

But that will also show you something important: the high outliers, the red points so far above the trend line, are gone with CPU 2006. That is essentially because the newer benchmark is “harder” with fewer easy performance wins which might not translate into real world performance improvements. It’s not that the processor developers and compiler writers of 2005 were “cheating” an old vulnerable benchmark. Rather they were exploiting more and more opportunities for speedups, and the dated applications in CPU 2000 did not respond to these optimizations in the same way that more complex applicaitons of 2005 responded. One big goal of SPEC benchmark design is to give no easy wins, but force higher benchmark numbers to be tied to solid improvements that benefit real users.

The systems which so far outstripped the SPECint_rate2000 trend line at the end of CPU 2000’s life were mostly Intel Xeons with a few Intel Core 2 processors at the top end. The world was learning what happens when a processor with a very large on-chip cache meets a relatively small problem size. CPU 2006 problem sizes were much larger, as were typical real world applications which had come to rely on all the increased computing power delivered over the past years.

As CPU 2006 has aged you again see more high outliers with performance far above the trend line. To some extent this is normal progress. These are the best performing processors, and in this way the trend line is self correcting via capitalism. That is, processors well below the trend line are taken off the market. The three highest points on the chart represent an Oracle SPARC T7-1 with 32 cores published November 2015, and two Intel Xeon Phi’s with 72 cores published December 2016 and March 2017.

Those systems are outliers because they deliver massive parallelism above that of the single and dual core processors typical at the debut of CPU 2006. But it’s also the case that CPU 2006 is ageing and some of that potential computing power does not translate well to real world applications. I’ll write more about parallelism and usable capacity in a later posting.

The story with floating point is much the same. Clearly it is time for a new SPEC CPU benchmark suite. The larger question for SPEC is, with such improvements does performance even matter any more? Spoiler alert: my answer is yes, and that will be the subject of a future posting.

Note: These are my ideas and opinions, with no SPEC “inside information.” I’m bound by the same confidentiality rules as any SPEC participant. These rules are not to conceal what the vendors are doing. Actually SPEC is quite an open organization. Rather there are two main points: 1) I cannot state SPEC (consensus) positions nor commit to product deliverables and dates. Only SPEC can speak for SPEC. And 2) I cannot relate positions of member companies, whether correctly or incorrectly related, as SPEC participants must feel free to argue and agree with one another.

SPEC elects David Reiner as president

I’ve turned over the reins of SPEC to David Reiner, a very capable leader who has much experience with standards as well as performance benchmarking.

http://www.marketwired.com/press-release/spec-announces-new-president-and-future-goals-2203170.htm

At SPEC David has the support of many of the top performance experts in the industry as SPEC continues to evolve. Engineers are assigned to SPEC on the basis of their technical prowess by many competing companies. You could basically call us geeks. But then success in SPEC, for the company and the individual, is driven also by those engineers’ ability to work with their competition, understand divergent views on the market and the direction of technological innovation, find common ground, and make compromises. Politics. (If they could do politics in Washington half as well as our bunch of “geeks” things would run so smoothly.) Those who rise to the top like David are those with both an engineer’s understanding of what is necessary and a politician’s understanding of what is possible.

I’m remaining active in SPEC, as assistant treasurer, which also allows me to continue some initiatives with the board of directors that I’d like to see through. And I’m working with the OSG Power committee to see how I might help with coding for a future power efficiency benchmark.