Among the challenges SPEC faces in addressing change in the computing industry is the very trend which SPEC has done more than anyone to bring about. That is the rapid growth in computing power – close to 10,000 times the single thread performance today as the venerable VAX-11/780.
Dr. Stephen Edwards teaches performance history at Columbia. See on this (log scale) relative performance chart the rate of increase taking off (+52% per year) in the early 80’s as the RISC vs. CISC wars ignited, sometimes called the benchMarketing wars as exaggerated and loosely substantiated claims were common, which in turn led to the creation of SPEC to standardize the metrics and test protocols. Edwards shows the rate of improvement slowing from 2002 down to +20% per  year.
Click on this chart through to his course handouts to see detail on the chart of processor names (remember Alpha?) and discussion of where the performance improvements came from. He discusses thermal and power issues driving the shift to multi-core, and the memory bottleneck.
 Now read Jeff Preshing’s analysis showing +52% increase per year slowing from 2004 to +21% per year. Preshing marks the inflection point with publication of Herb Sutter’s paper “The Free Lunch Is Over: A Fundamental Turn Toward Concurrency in Software.” Today’s processors are multi-core and those cores are mostly multi-threaded. Preshing also observes that the rate of increase for non-Intel processors has been only +13% per year.
Now let’s look not just at single thread speed but at the total computational power available to applications running on the processor. I considered all compliant CPU 2000 and CPU 2006 results published on spec.org of the “rate” or computational throughput metric, for systems with a single processor. I used the “peak” or highly tuned metric and for a small number of results with no peak metric I used their “base” metric. This gave me about 800 each integer and floating point results for CPU 2000, and 3,000 each for CPU 2006.
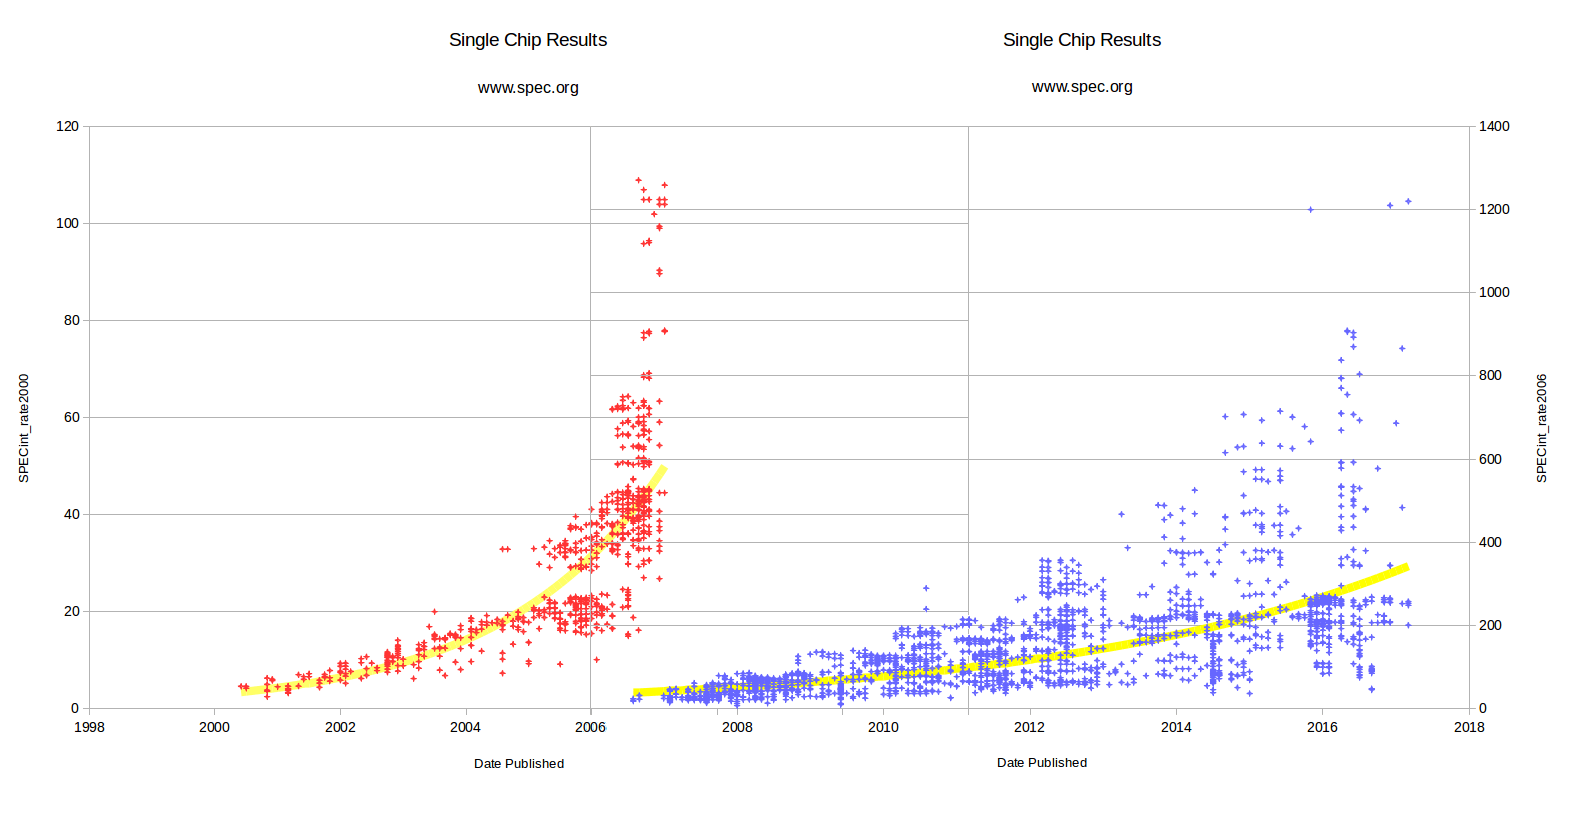
Here are the integer results plotted on a linear scale with a trend line plotted as a logarithmic least squares regression. In 2006 you  see the transition with a brief overlap when SPEC published results from both the old and the new benchmarks. I did not attempt to normalize the two benchmarks to a common scale as some have done because there is no simple “conversion factor” from CPU 2000 to CPU 2006. If there were, of course SPEC would have had no reason to develop the latter benchmark. You can see generally how such a normalization would work by moving the CPU 2006 graph up so that its trend line starts where the CPU 2000 trend line ends.
But that will also show you something important: the high outliers, the red points so far above the trend line, are gone with CPU 2006. That is essentially because the newer benchmark is “harder” with fewer easy performance wins which might not translate into real world performance improvements. It’s not that the processor developers and compiler writers of 2005 were “cheating” an old vulnerable benchmark. Rather they were exploiting more and more opportunities for speedups, and the dated applications in CPU 2000 did not respond to these optimizations in the same way that more complex applicaitons of 2005 responded. One big goal of SPEC benchmark design is to give no easy wins, but force higher benchmark numbers to be tied to solid improvements that benefit real users.
The systems which so far outstripped the SPECint_rate2000 trend line at the end of CPU 2000’s life were mostly Intel Xeons with a few Intel Core 2 processors at the top end. The world was learning what happens when a processor with a very large on-chip cache meets a relatively small problem size. CPU 2006 problem sizes were much larger, as were typical real world applications which had come to rely on all the increased computing power delivered over the past years.
As CPU 2006 has aged you again see more high outliers with performance far above the trend line. To some extent this is normal progress. These are the best performing processors, and in this way the trend line is self correcting via capitalism. That is, processors well below the trend line are taken off the market. The three highest points on the chart represent an Oracle SPARC T7-1 with 32 cores published November 2015, and two Intel Xeon Phi’s with 72 cores published December 2016 and March 2017.
Those systems are outliers because they deliver massive parallelism above that of the single and dual core processors typical at the debut of CPU 2006. But it’s also the case that CPU 2006 is ageing and some of that potential computing power does not translate well to real world applications. I’ll write more about parallelism and usable capacity in a later posting.
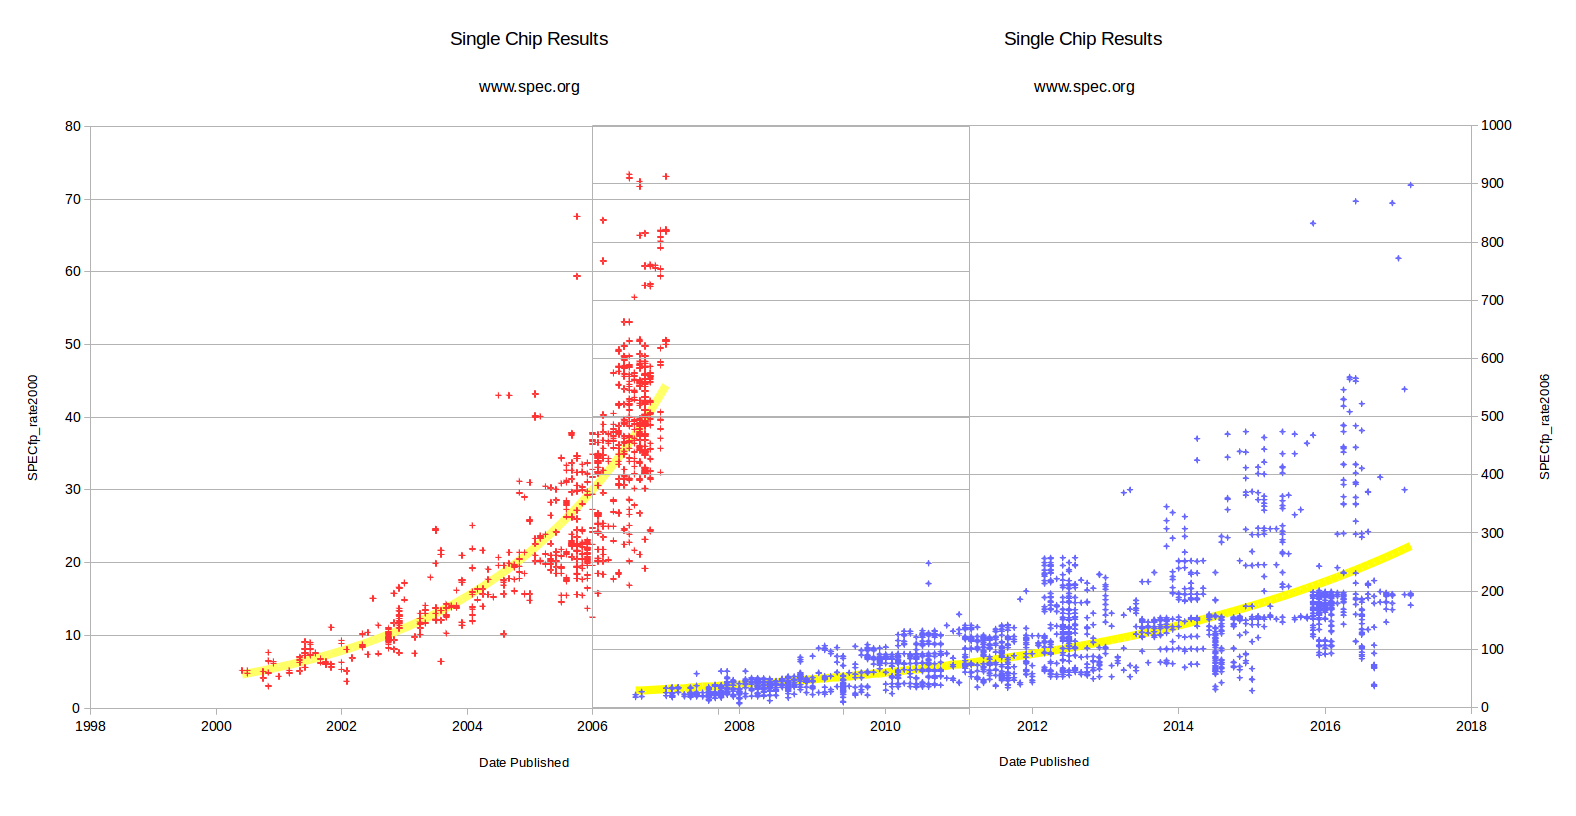
 The story with floating point is much the same. Clearly it is time for a new SPEC CPU benchmark suite. The larger question for SPEC is, with such improvements does performance even matter any more? Spoiler alert: my answer is yes, and that will be the subject of a future posting.
Note: These are my ideas and opinions, with no SPEC “inside information.” I’m bound by the same confidentiality rules as any SPEC participant. These rules are not to conceal what the vendors are doing. Actually SPEC is quite an open organization. Rather there are two main points: 1) I cannot state SPEC (consensus) positions nor commit to product deliverables and dates. Only SPEC can speak for SPEC. And 2) I cannot relate positions of member companies, whether correctly or incorrectly related, as SPEC participants must feel free to argue and agree with one another.

 The SPEC ACCEL™benchmark is a suite of computationally intensive parallel applications executed to measure performance of the accelerator, host CPU, memory transfer between host and accelerator, support libraries and drivers, and compilers. 15 applications are executed 3 times each, with moderate tuning and with aggressive tuning to yield a base and peak score. This benchmark should be increasingly important as the industry embraces hybrid computing for applications like machine learning. For my purposes today the key point is that different workloads are executed, and that the benchmark allows energy consumption to be measured using the SPEC Power methodology.

 ting companies. You could basically call us geeks. But then success in SPEC, for the company and the individual, is driven also by those engineers’ ability to work with their competition, understand divergent views on the market and the direction of technological innovation, find common ground, and make compromises. Politics. (If they could do politics in Washington half as well as our bunch of “geeks” things would run so smoothly.) Those who rise to the top like David are those with both an engineer’s understanding of what is necessary and a politician’s understanding of what is possible.